SUCCESS CASE STUDY

Impact Atlas
Challenge: Paper based poverty reduction program was not scalable or efficient.
Opportunity: A global SaaS platform serving 10s of millions.
GOALS
Countries
19
Funds Distributed
$10M+
Languages Served
7
Cohort Growth
25%+
TOOLS
Sketch
Figma
Photoshop
Miro
JIRA
SKILLS + TEAM
Prototyping
Journey Mapping
User Testing
Field Research
Lead Designer, visual Designer, Business Owner, and Dev Lead.
Research + Discovery
Field Shadowing — Bangladesh
Cross-Role Journey Map
Axure Prototype
I Shadowed field staff in rural Bangladesh to map data flows, paper systems, reporting gaps.
It was always very hot. All the photos are mine.
Once I got back from Bangladesh, having lived and breathed everything cohort related, I was able to just do a 'data dump' into this journey map.
It really brought the team together, everyone now understood their part at a glance.
More design assets were to follow, I used Axure pro to get a working prototype together.
Wireframes and Specs
Low-Fi to Clickable Prototype
Field Staff + Funder Flows
Low-fi wireframes → clickable prototype → stress-tested build.
Field staff and funders, same flow.
These wireframes were all mine, I literally designed the entire application.
Final Designs, Outcomes and Takeaways
Another project which was polished after I left, but clearly my design directions and intentions were preserved.
I remain particularly proud of this achievement and I hope I can make similarly substantive contributions in the future.
Key RESULTS
Countries
19
Funds Distributed
$10M+
Static Reports
Retired
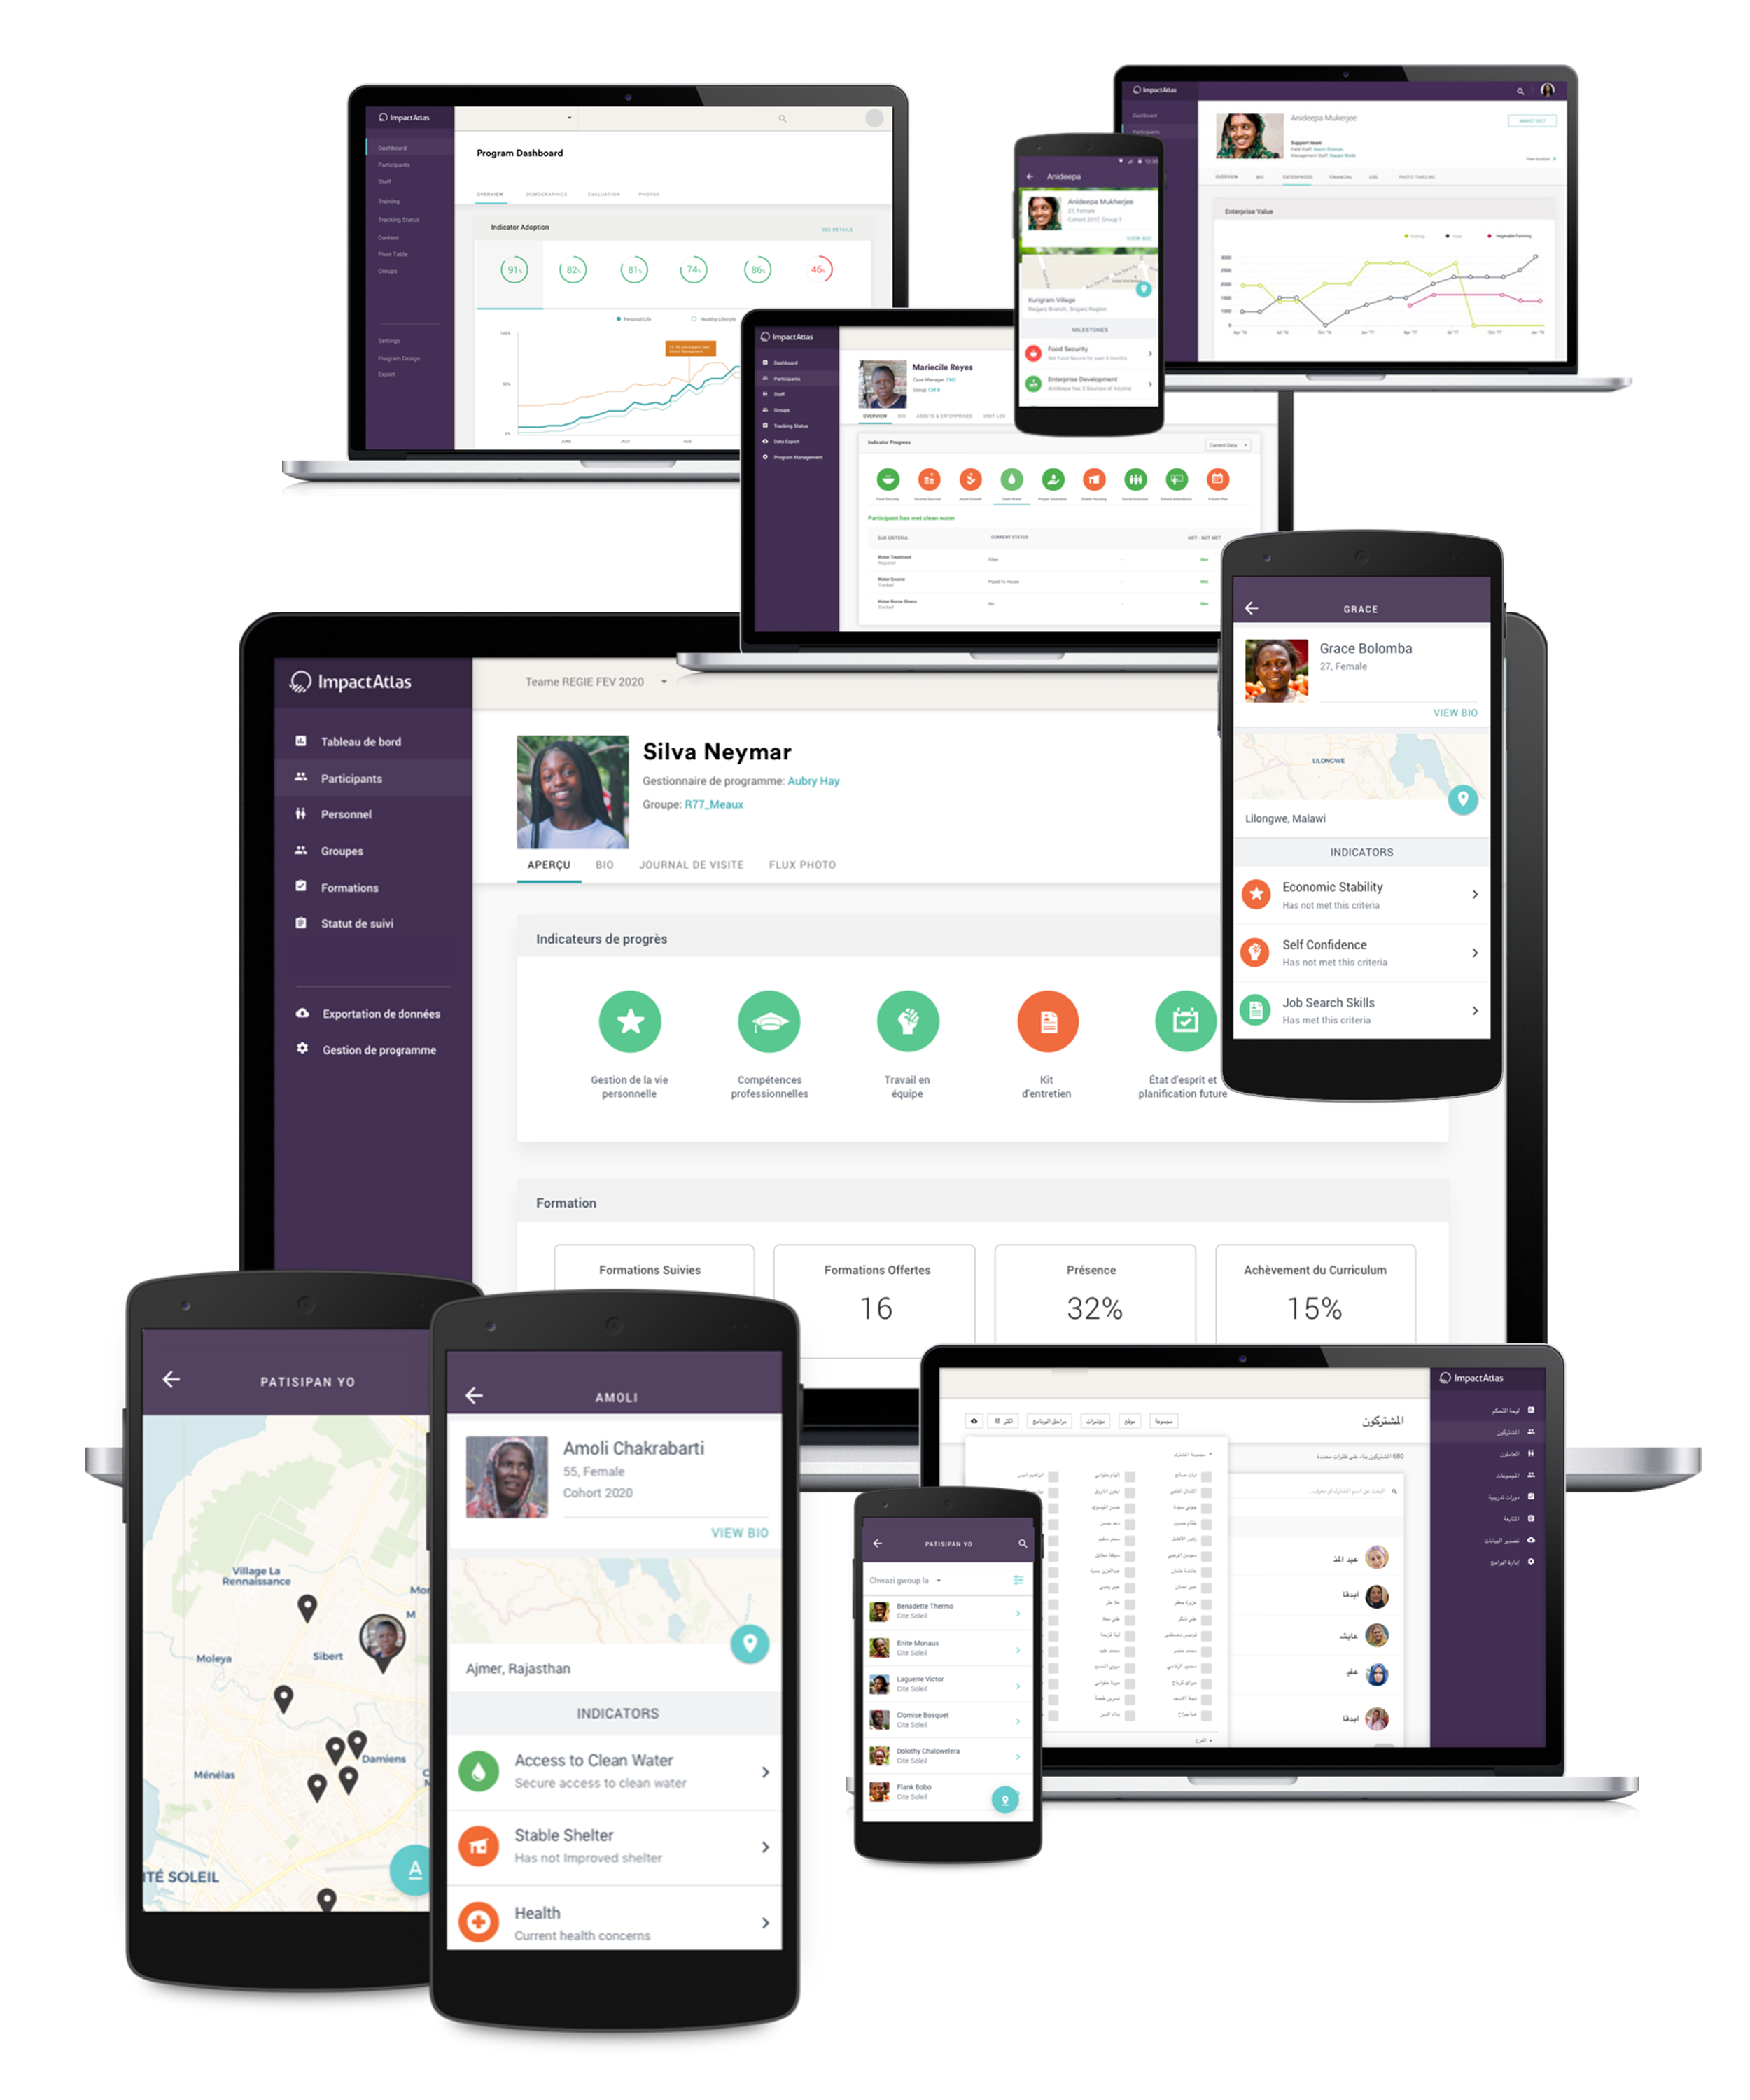

Field conditions in rural Bangladesh — the environment data collection happens in.

Reviewing a real distribution ledger with field staff.

Participants recording their own data during a group session.

A real BRAC passbook, reviewed in the field — the paper system being replaced.

Whiteboarding user roles across Android, Web, and each management tier.

User stories for every stakeholder, from Program Organizer to Regional Manager.

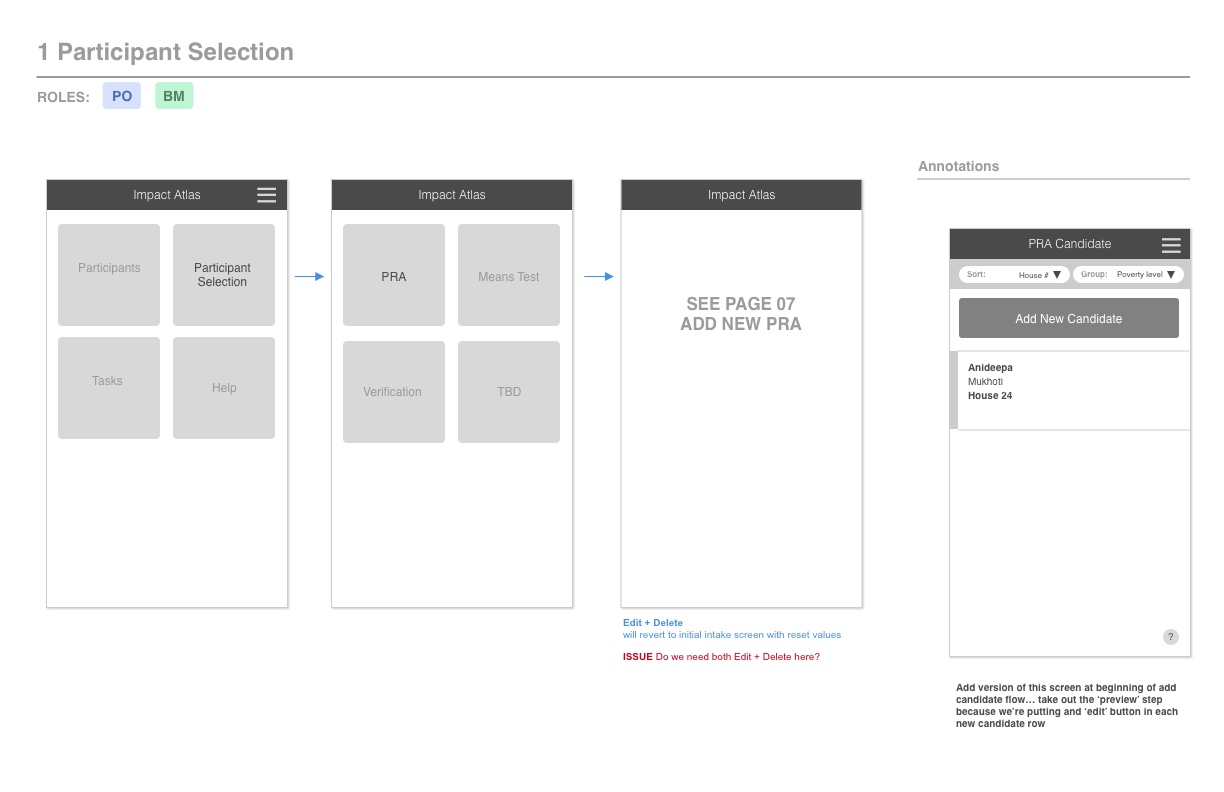
Mapping the participant selection and means-test process.

Project roadmap and tech stack, whiteboarded with the dev team.

The full field-to-graduation journey, mapped step by step.
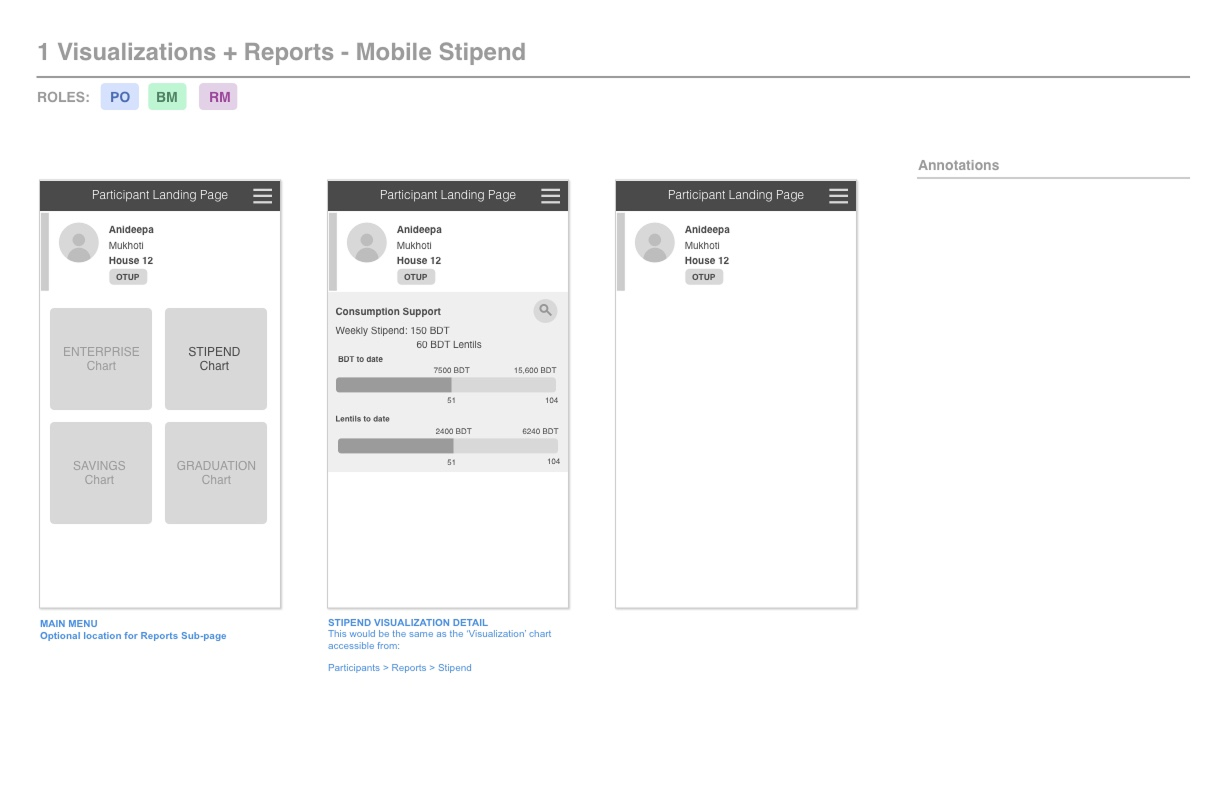
Early low-fidelity wireframe — participant landing and stipend visualization.
Early low-fidelity wireframe — participant landing and stipend visualization.
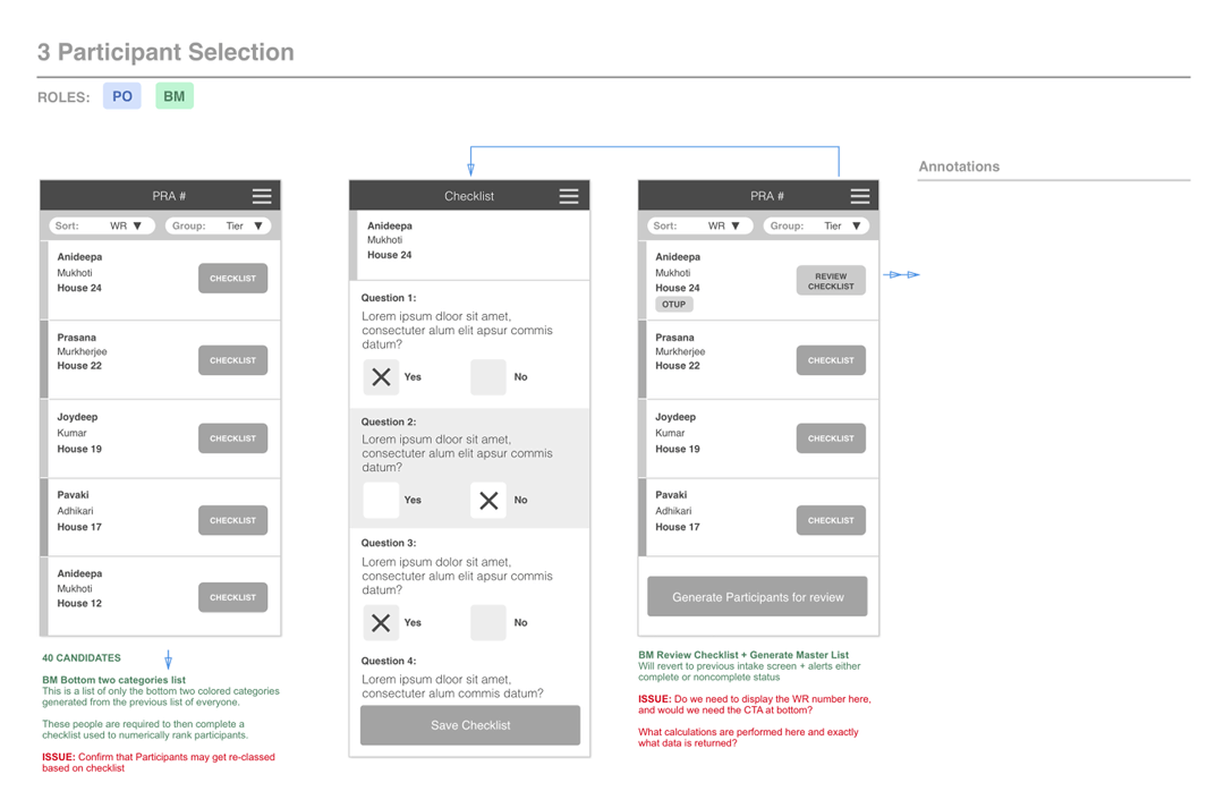
Mid-fidelity wireframe with open questions and issues flagged.

Refined mockup — Participant Profile, milestones and indicators.
Refined mockup — Participant Profile, milestones and indicators.
Refined mockup — Participant Profile, milestones and indicators.